|
GLOBE Schoolyard Surface Temperature Campaign 2005! Thank you who participated in the field campaign! Students from elementary, middle, and high schools as well as college students collected surface temperature measurements using Thermal Infrared Thermometers (IRTs). The following is a report of their observations. During the spring and fall 2005, Dr. Czajkowski, GLOBE scientist for the surface temperature protocol asked students to measure the surface temperature of their schoolyards. Below is an analysis of the observations that were taken. Students in Iowa developed inquiry-based research projects using their surface temperature and other GLOBE observations as well as the observations from other schools. They presented their results to other Iowa students, parents, teachers and several GLOBE scientists at the Hartman Reserve Nature Center in Cedar Falls, IA, February 10, 2006. You can watch videos of their presentations at: Iowa Surface Temperature Presentations. Thank you for your help Marcy! We performed a surface temperature comparison of agricultural fields in Iowa to investigate the impact tillage practice has on the temperature of the field. The tilled fields were 3º C on average than the no-till fields. The power point from the project can be viewed at: Tillage Impact on Temperature. In addition, Timothy Ault, a research scientist, has processed MODIS satellite images of the Great Lakes region of the United States that can be accessed here, Great Lakes MODIS Surface Temperature Images. 72 schools from around the world collected a total of 2,038 observations in 2005. The field campaign dates were: April 1-May 6, 2005 October 17-November 23, 2005 But, many schools took observations at others times throughout the year.
Our next field campaign will be in the fall 2006. Watch for the announcement!
Some schools took a lot of observations, such as
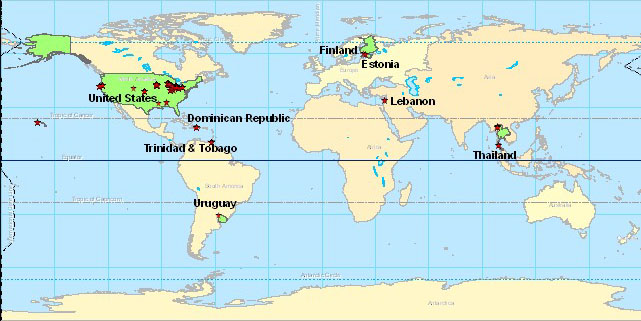
But, taking the observations is only half the process. We need to look at the observations, how surface temperature compares between locations, how it changes over time, and how it changes for different cover types, to derive conclusions about the way that surface temperature varies! This is the fun part. Please take some time to look at the observations you took and observations that have been taken around the world. It Was a Global Surface Temperature Campaign!
Each red star on the map represents a school where students collected surface temperature, clouds and snow observations during the campaign. We had measurements taken from all over the world in eight different countries (highlighted in green):
The Observations Included the Following
Data Breakdown by Cover Type Most of the data collected was either measured on short grass, asphalt, or concrete. A few measurements were taken on different surfaces. Hoover Middle School (Iowa), Monroe High School (Michigan), and Shaker Heights Middle School (Ohio) measured surface temperature in tall grass (higher than 50cm). Virkby Gymnasium, in Finland, measured surface temperature in shrubs, and Winchester Thurston School, in Pittsburgh, PA, collected their surface temperature measurements from field turf: a mix of artificial grass and rubber pellets. Chart 1 Chart 1 - Most of the observations appear on the charts as two clumps. This is because most of the measurements were from either or spring field intensive (April 1 - May 6, 2005) or from the fall field intensive (October 17 - November 23, 2005). Hawaii (Black) and Alabama (Orange) also collected data, but during the summer outside of the intensives. Their readings indicate a warm summer. Notice the red point in the bottom center of the graph, indicating a measurement of 3.6 degrees Celsius in the middle of July. The red dot is a surface temperature measurement taken in Uruguay, a country located in South America, south of the equator. In Uruguay, July is wintertime, hence the low surface temperature measurement. Chart 2 Chart 2 - Only a few schools is Iowa collected surface temperature measurements on asphalt during the spring intensive, but many schools in Ohio and Michigan collected surface temperature on asphalt for the fall intensive. Waterloo Presbyterian, located in Carapichaima, Trinidad & Tobago (magenta) collected through both intensives and the summer months. Chart 3 Chart 3 - Only a handful of schools from Iowa, Michigan, and Kansas collected surface temperature measurements for concrete in either intensive. No schools from Ohio measured on this cover type. International locations like Lebanon and Estonia only collected measurements on concrete. Our Hottest Measurement: 57.7ºc (136ºF!) Chart 4 Chart 4 - Waterloo Presbyterian in Carapichaima, Trinidad & Tobago has the hottest surface temperature measurement of our 2005 campaign taken on asphalt on April 23, 2005.Their highest recorded temperature was 57.7ºc. That's 136ºF - hot enough to slowly fry an egg! Asphalt, of all the cover types measured in the campaign, has the highest surface temperature on average. Also, Trinidad & Tobago is located in South America near the Equator. This means that temperatures should be hot and steady year-round. Notice how the measurements seem to clump in two places; around 50º C and around 35º C. This difference seems to be caused by rainfall. Notre Dame School in Santo Domingo, Dominican Republic deserves an honorable mention for its warm schoolyard temperatures. The Spring Intensive Our 2005 Spring Intensive started on April 1, 2005 and ended May 6, 2005. We had participants from California, Iowa, Ohio, Oregon, and Trinidad & Tobago, collect measurements. Chart 5 Chart 6 Charts 5 & 6- Eight of the sites measuring surface temperature on grass were from Iowa. April can be a time of great fluctuation in weather, as seen by the measurement taken by Immaculate Conception from Gilbertville, IA from May 2-6, 2005. Chart 7 Chart 8 Charts 7 & 8- With the exception of measurements taken by Waterloo Presbyterian in Trinidad & Tobago, all of the surface temperature measurements taken on asphalt or concrete in our spring 2005 intensive were from Iowa. St. Edward School and Orchard Hill Elementary School took multiple measurements on the same day, usually about an hour apart. From these observations we can see how surface temperature can fluctuate during a single day. On April 4, 2005, the change in surface temperature observed by St. Edward was around 11ºC, and on April 12, 2005 the change in surface temperature observed by Orchard Hill was around 15ºC. Also, notice how much warmer Trinidad & Tobago's surface temperature is in comparison. This difference is because Trinidad & Tobago is closer to the equator and has a much warmer climate than Iowa. The Fall Intensive The Fall 2005 field intensive was heavily represented by schools in Ohio and Michigan, though schools from Iowa, Pennsylvania, and Kansas also collected surface temperature measurements. Weather patterns during the Fall intensive indicate a gradual drop in temperature in weeks 4 and 5 (November 7 - November 18, 2005). Chart 7 Chart 7 - Here the average surface temperatures from all sites are broken down by state for grass. Pennsylvania, Ohio, and Michigan (Lower Great Lakes sites) follow a similar trend in temperature during the campaign. Iowa and Kansas also follow similar trends in temperature during the campaign, though not as closely as the Great Lakes States. One international site, in Thailand, participated in the fall intensive, but only over the first week. Since Thailand is in a warmer climate, their temperatures are the highest reported during the fall intensive for grass. Chart 8 Chart 8 - Once again here are the average surface temperatures from all sites broken down by state for asphalt. Pennsylvania, Ohio, and Michigan (Lower Great Lakes sites) follow a similar trend in temperature during the campaign. Iowa also follows a similar trend with the Great Lakes states during the campaign. The two international sites, in the Dominican Republic and Trinidad & Tobago, participated in the fall intensive. Notre Dame School, in Santo Domingo, Dominican Republic collected measurements for the first 2 weeks of the campaign. Located in the Caribbean, their temperatures are much warmer than those from the US sites. Trinidad & Tobago's temperature throughout the intensive stays relatively unchanged, and very warm. Located neat the Equator in South America, Trinidad & Tobago's climate is much warmer than US sites. Chart 9 Chart 9 – This graph shows the average surface temperatures from all sites broken down by state for concrete. Ohio did not have any sites measuring surface temperature on concrete. Michigan, Iowa, and Kansas each had a few sites measuring the surface temperature of concrete. Two international sites, one in Lebanon and one in Estonia, only measured surface temperature on concrete. The two observations made in Lebanon, in the Middle East, are warmer than any of the other sites' observations. Estonia, located in Northern Europe, observed cooler temperatures in their three measurements. Iowa observed a noticeable drop in surface temperature between November 14-16, 2005.
Chart 10 Chart 10 - Most of our surface temperature campaign participants came from Ohio during the fall intensive. This graph shows 21 schools' observations of surface temperature on grass. Also, the white line indicates the average surface temperature for the 26 Ohio sites. Our Coldest Measurement -was taken by Maple Leaf Intermediate in Garfield Heights, Ohio (pink) at -8.6ºC on November 16, 2005. Their measurements consistently were amongst the coldest for Ohio during the campaign. In the comments that they entered with their GLOBE observations, Maple Leaf Intermediate describes their site by listing, "Our study site is a soccer field. Some of the readings were taken in an area where the grass had been kicked up, therefore there was mud." Thus, it is possible that their temperatures are amongst the lowest because of the presence of water in the mud and possibly a lack of grass. Chart 11 Chart 11 – Many schools from Michigan also participated in the fall intensive. Seven schools collected observations of surface temperature on grass. Orchard View Middle School in Muskegon, MI also reported a very cold surface temperature on November 17, 2005 of -6.9ºC. Chart 12 Chart 12 - Ohio also had 10 sites measuring surface temperature on asphalt during the fall intensive. Here they are graphed along with their average temperature (white). Chart 13 Chart 13 - Lastly, here are the Michigan sites measuring surface temperature on asphalt for the fall intensive. Whitehall High School collected measurements from two asphalt sites. They are graphed together here in purple and magenta. Thanks to everyone who participated
in our 2005 surface temperature campaign.
This material is based in part upon work supported by the National Science Foundation under Grant Number GEO-0222905 and SES-0243872. Any opinions, findings, and conclusions or recommendations expressed in this material are those of the author(s) and do not necessarily reflect the views of the National Science Foundation.
|
||||||||||||||||||||||||||||||||||||||||||||||||||||||||||||||||||||||||||||||||||||||||||||||||||||||||||||||||||||||||||||||||||||||||||||||||||||||||||||||||||||||||||||||||||||||||||||||||||||||||||||||||||||||||||||||||||||||