

Introduction
Data
Methodology
Results
Discussion
Reference
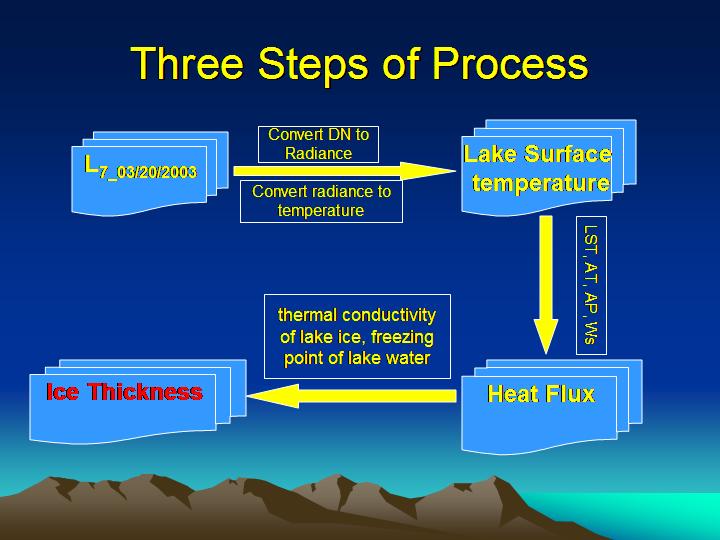
This project aims at estimating ice cover thickness on Lake Erie through analysis of Landsat 7 thermal band data and meteorological data. This goal is achieved by a three step process: calibration of band 6 to gain lake surface temperature, calculation of heat flux of the ice surface, and finally extraction of ice thickness information through the relationship between heat flux and ice thickness.
Ice cover has very important environmental, social, and economic effects. Ice cover influences almost every aspect of economic activities on Lake Erie from hydropower generation to commercial shipping to the fishing industry (GLERL, Introduction to Great Lakes Ice Cover). Sometimes, people lost their lives due to their ignorance of ice cover conditions. Ice thickness is an important characteristics of ice cover. It directly indicates the usefulness of ice for different activities on the ice cover. Thus, effective and efficient measurement the ice thickness is very important. This project discussed one possible approach to extract ice cover thickness information from Landsat 7 thermal band and meteorological data.
Since Lake Erie has small dimensions in comparison to the spatial resolution characteristics of many satellite sensors, monitoring ice thickness requires high resolution sensors, or by special processing of the images of meteorological satellites to emphasize fine detail (McGinnis and Schneider, 1978). Considering this factor, the availability of different types of data, and the costs of getting new data, I choose Landsat 7 images for this study, which have relatively high spatial resolution (for thermal band 60m) and are free through OhioView. After examining all the available Landsat 7 images for Lake Erie area, I found two images that do have ice cover and are cloud clear. However, one of them is almost completely snow covered, which may complicate the problem in the beginning. Finally, I selected the image from March 20th, 2003 and took its subset as my study area.
Learn about details? Click here.
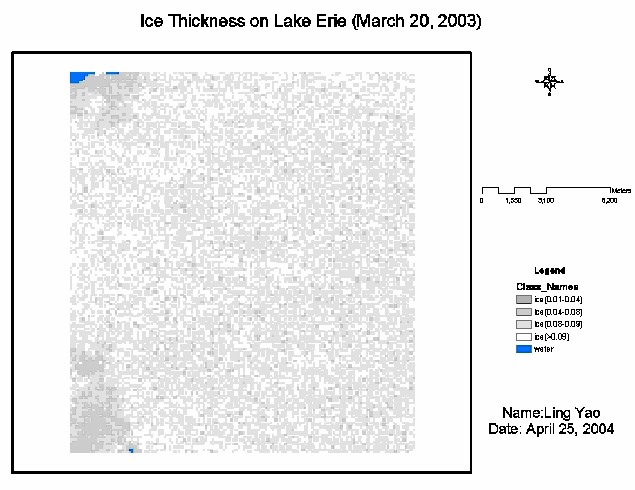
Minimum thickness: 0.009425m
The error in the retrieved ice thickness is based on uncertainties in the following variables: the surface temperature derived from the Landsat7 thermal band, air temperature, the surface wind speed, air pressure and relative humidity. TM/ETM+ has only one thermal band (10.44-12.42 μm), which makes the use of general split-window correction algorithm impossible. Ideally, a gridded meteorological data for the study area should be built instead of assuming a homogeneous condition. These two aspects will lead to our future work on this project.
Robert Drucker, Seelye Martin, and Richard Moritz. Observations of ice thickness and frazil ice in the St. Lawrence Island polynya from satellite imagery, upward looking sonar, and salinity/temperature moorings. Journal of Geophysical Research, Vol. 108, No. C5, 3149, doi: 10.1029/2001JC001213, 2003.
Mark F. Meier. Remote Sensing of Snow and Ice. United Nations Educational, Scientific and Cultural Organization.
Jiansheng Yang and Y.Q. Wang. Estimation of Land Surface Temperature Using Landsat7 ETM+ Thermal Infrared and Weather Station Data.
Robert Bindschadler, Julian Dowdeswell, Dorothy Hall, Jan-Gunnar Winther. Glaciological application with Landsat7 Imagery: Early Assessments. Remote Sensing of Environment, 78 (2001) 163-179.
feae
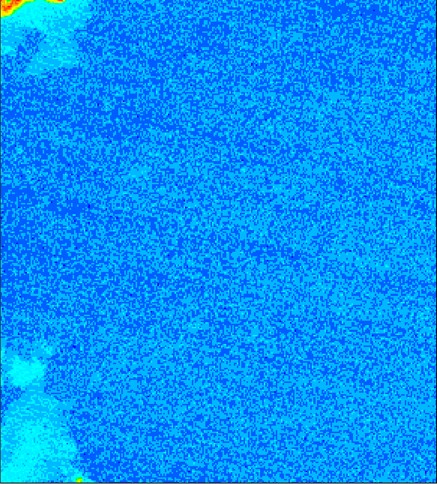
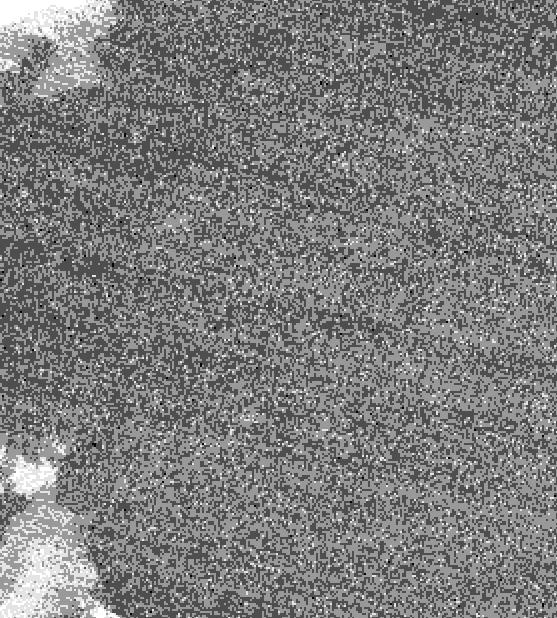
f Landsat 7 Image 03/20/2003 0303feaefLand
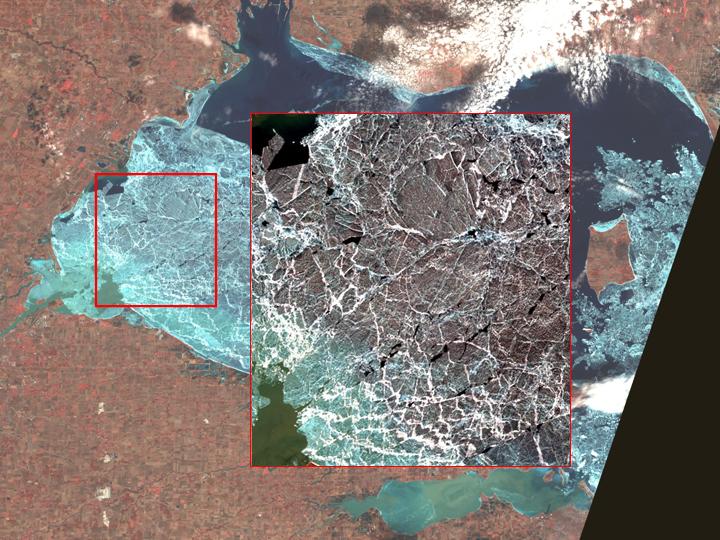
Study Area
subset of the image
¡¡
Surface Temperature
Heat Flux
Comments?
Email Me