Results
The area at the eastern end
of the Nyando basin shows what appears to be the
greatest change in NDVI values independent of changes due to agricultural
factors such as crop rotation and fallow periods as seen in the agricultural
areas in the northwestern section of the basin.
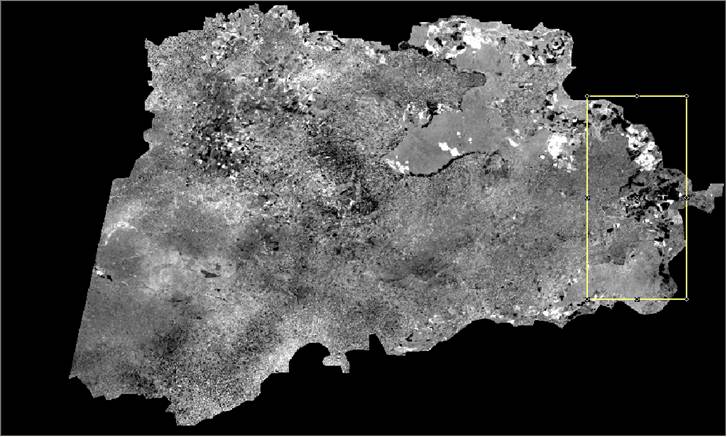
NDVI Difference image p169r60
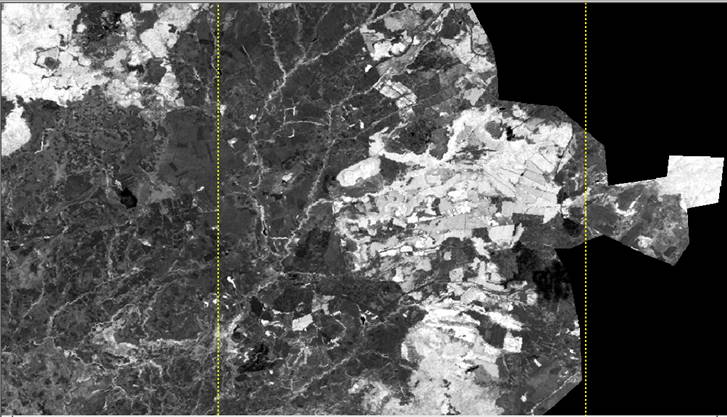
1986
NDVI
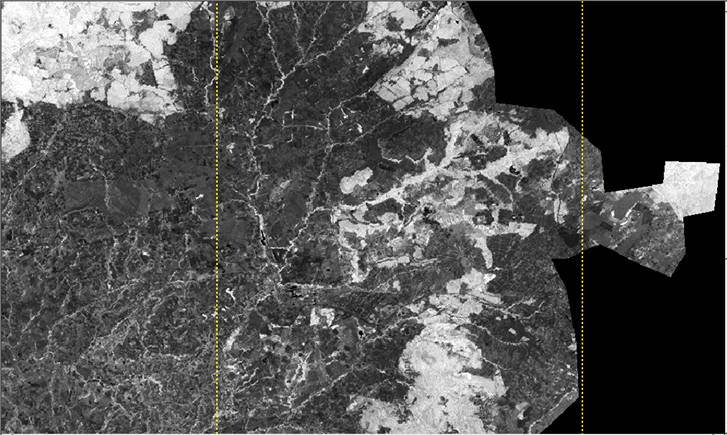
2000
NDVI
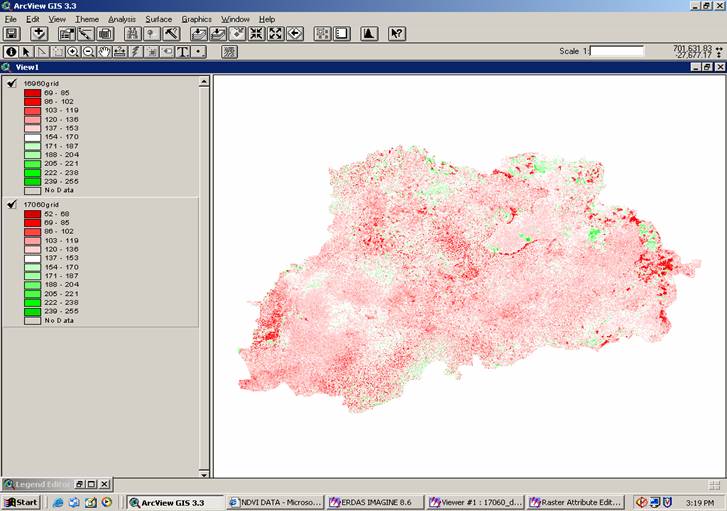
Results displayed in ArcView
Negative change NDVI values
are represented by green and positive change values are represented by red.
White represents little change. Displaying along the continuum allows for error
(e.g. lighter red and green areas may represent little to no change). These
results indicate that the