Methodology
· Each band of the imagery was downloaded
from the
· A watershed AOI was created using a
reference image from the
· Normalized Difference Vegetation Index
(NDVI) was calculated for all images in the Erdas
Modeler using the algorithm: (NIR-IR)/(NIR+IR)
for Landsat 5 and 7
images bands 3 and 4 are used:
(b4-b3)/(b4+b3)
· A difference image was then created by
subtracting the 2000 NDVI images from the 1986 NDVI images.
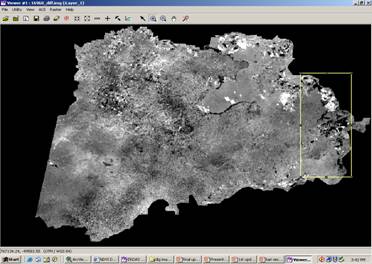
Difference
image p169r60
· Convert NDVI images from DN to 8-bit for
use in ArcView
(n-min)x255/max-min
è Image scaled to 0-255.
· Convert to grid in ArcView
· Identify areas with extreme change (as highlighted
in above image)