|
|
Urban
Development changes detected by NDVI in Rossford, Perrysburg, Christina
Stevens Geography
and Planning, |
![]()
This study identifies changes in land
development by detecting loss of vegetation to new growth in residential,
commercial, industrial areas. The Normalized Difference Vegetation Index
(NDVI) is used to measure density of plant growth over an area of space.
Increasing development in Rossford, Perrysburg, and
![]()
Introduction
As a resident of
|
Total Population Growth |
1990 |
2000 |
Percentage
of Change |
|||
|
City |
Total |
>18 years |
Total |
>18 years |
Total |
>18 years |
|
Perrysburg |
12,551 |
9,083 |
16,945 |
12,037 |
35% |
33% |
|
|
13,176 |
10,178 |
13,613 |
9,973 |
3% |
-2% |
|
Rossford |
5,861 |
4,440 |
6,406 |
4,780 |
9% |
8% |
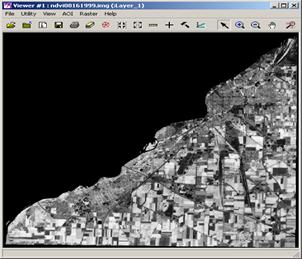
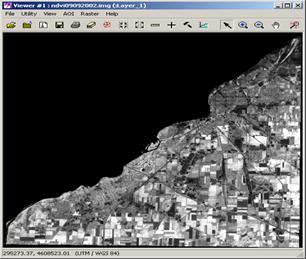
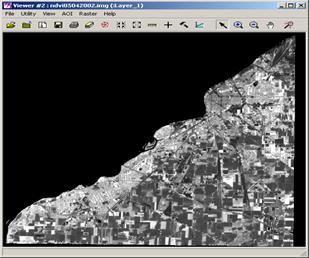
The Normalized Difference Vegetation Index
(NDVI) is used to measure density of plant growth over an area of space.
When you subtract an image from a year to a later year, NDVI identifies areas
where plant growth no longer exists. It was very important to incorporate
images from the same time period because, absorption and reflection of the
sunlight is measured by wavelength readings. NDVI measures chlorophyll in
the plant leaves, which absorb visible light (from 0.4 to 0.7 µm) for the
activity of photosynthesis. The cell structure of the leaves, on the other
hand, strongly reflects near-infrared light (from 0.7 to 1.1 µm). The more
leaves a plant has, the more these wavelengths of light are affected,
respectively. A zero means no vegetation and close to +1 (0.8 - 0.9)
indicates the highest possible density of green leaves. Images from the
dates
![]()
Data Used
Stacked subsetted Landsat 7 (2031)
images.
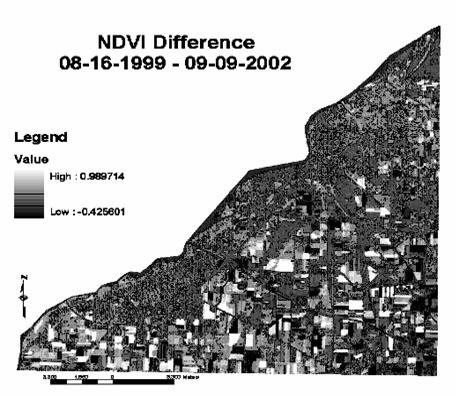
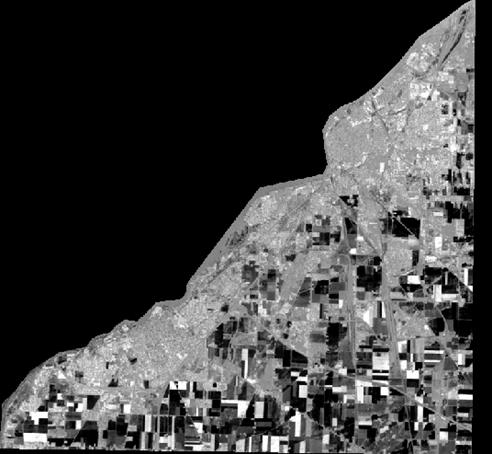
NDVI was measured for all images.
All of the NDVI images were transformed from gray scale to a brown to green
(high to low) scale for better viewing.
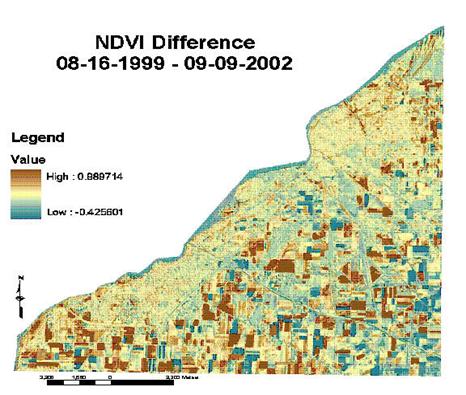
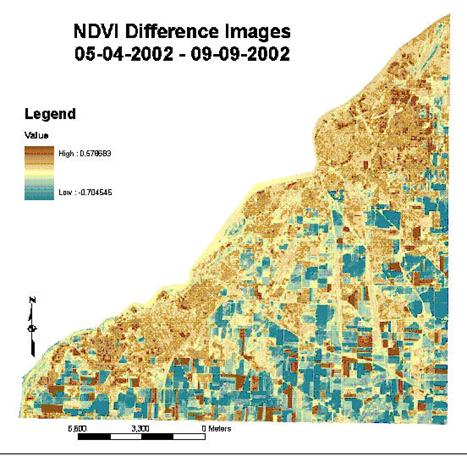
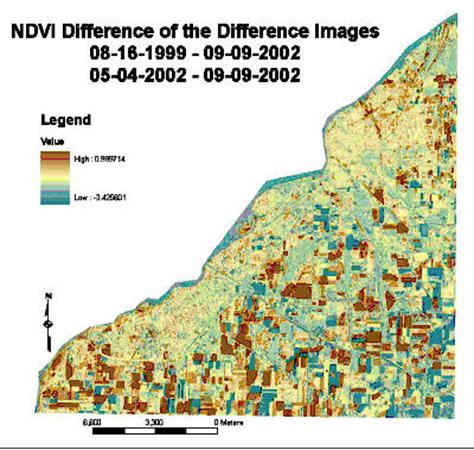
NDVI Difference Images
Brown color represents a high change in
NDVI, whereas, the green shows a low change in NDVI. The NDVI values are
indicated on each individual map.
Equation
![]()
Equation
![]()
Difference of the difference image
Photographs
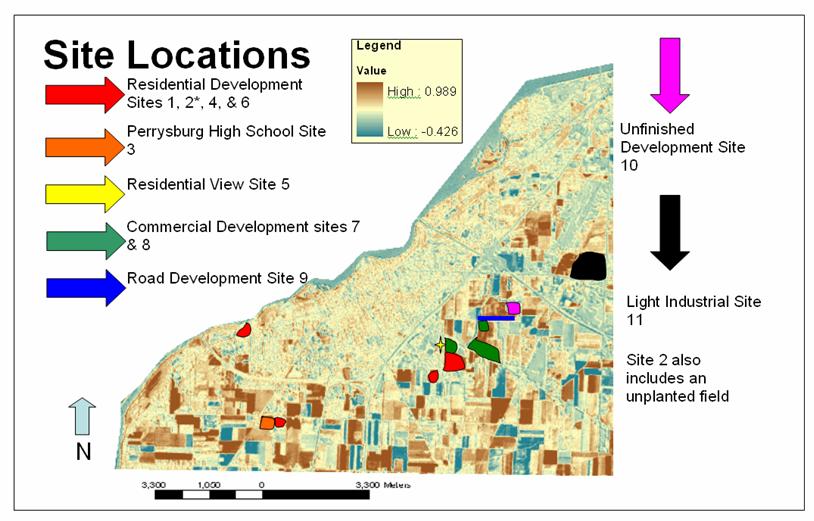
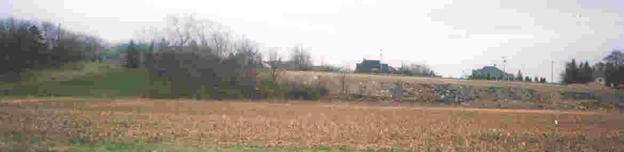
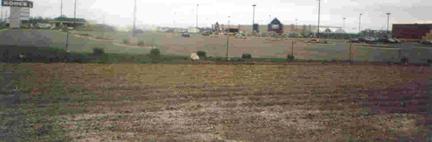
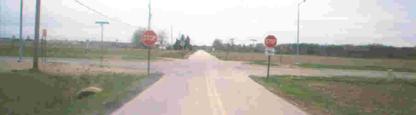
Site 1
Route 65 East of 475
Site 2
Route 65 East of 475
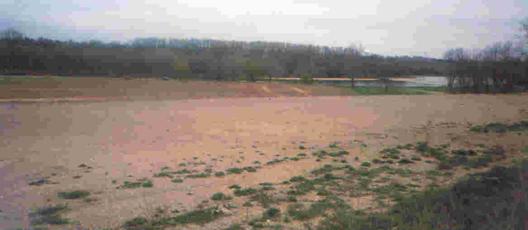
Site 3
View in the opposite
direction
Site 4
Eckel Junction
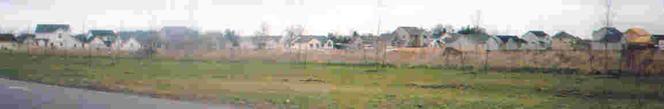
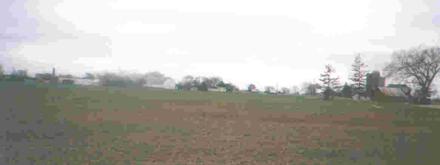
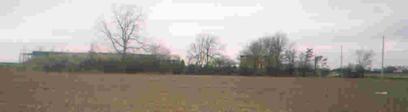
Site 5
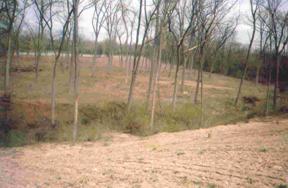
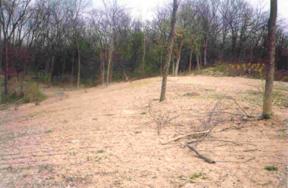
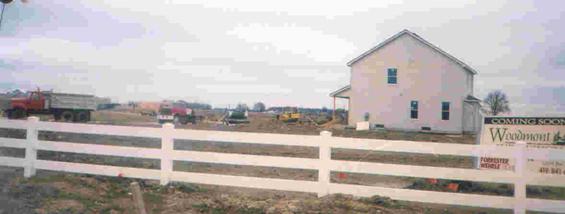
Residential View – once was a field
Site 6
Residential Development
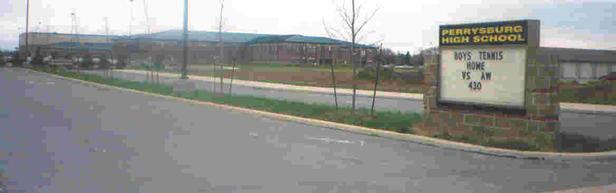
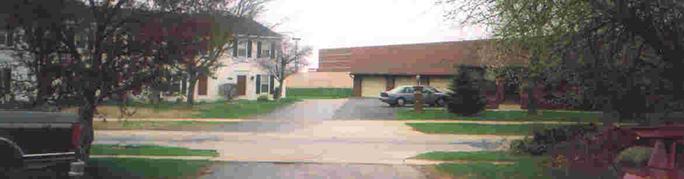
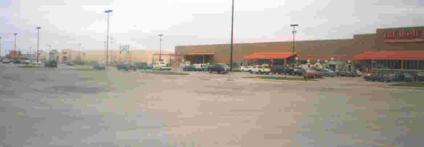
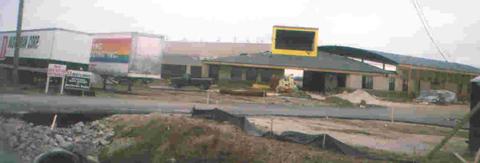
Site 7
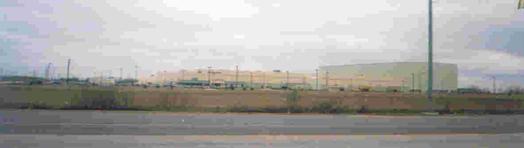
Commercial Development
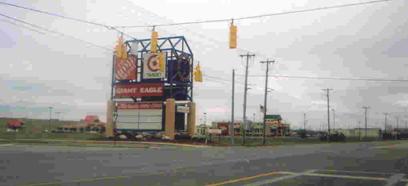
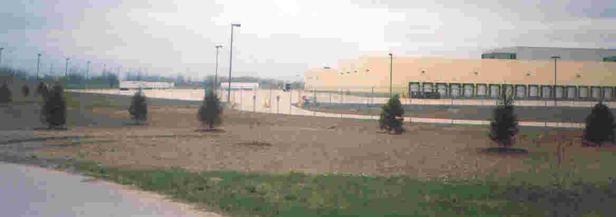
Site 8
Commercial Development
Site 8
opposite view
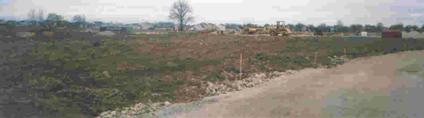
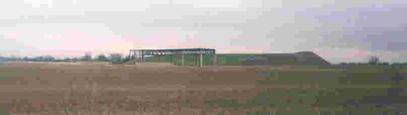
Site 9
Road Development
Same location –
Baseball training camp
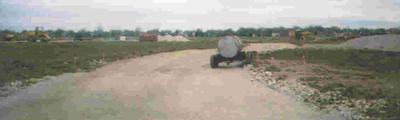
Site 10
Rossford Amphitheatre
Site 11
Light Industrial
![]()
Results
histogram table from proposal 1
Final map for Site Locations
![]()
Conclusion / Future Direction
This project will be
beneficial for future urban planning discussions. The results
of this study shows specifically how the cities are developing. At
this moment, the three cities are growing in "pockets." With the area
of land available, and the speed of development the cities are growing, it
would imperative to insist on sustainable growth. This could reduce
unavoidable costs. This would also enhance long term benefits for future
generations. Smart Growth concepts should be addressed. Mixed-use
zoning, pedestrian friendly walkways, and value of green space will promote
organized growth. Also, PerrysburgTownship, a
bedroom community, does not have a town center or community center. The
town center could be located around the proximity of the police station.
Additional research
would involve GIS integration. GIS would be an excellent tool for future
analysis to integrate data from the
![]()
Bibliography
http://earthobservatory.nasa.gov/library
·
· “Urban
Climatology and Air Control. Remote
Sensing, Heat Island
· Weier, john.
“Urbanization’s Aftermath.” Earth
Observatory.
US Census Bureau